These categories are often one of the largest emissions sources after categories 1 and, where applicable, 11. They cover the emissions from transportation of physical goods to and from the reporting company. They also encompass storage and display in third party buildings, such as warehouses or retail, referred to as distribution.
What is the difference between upstream and downstream transportation?
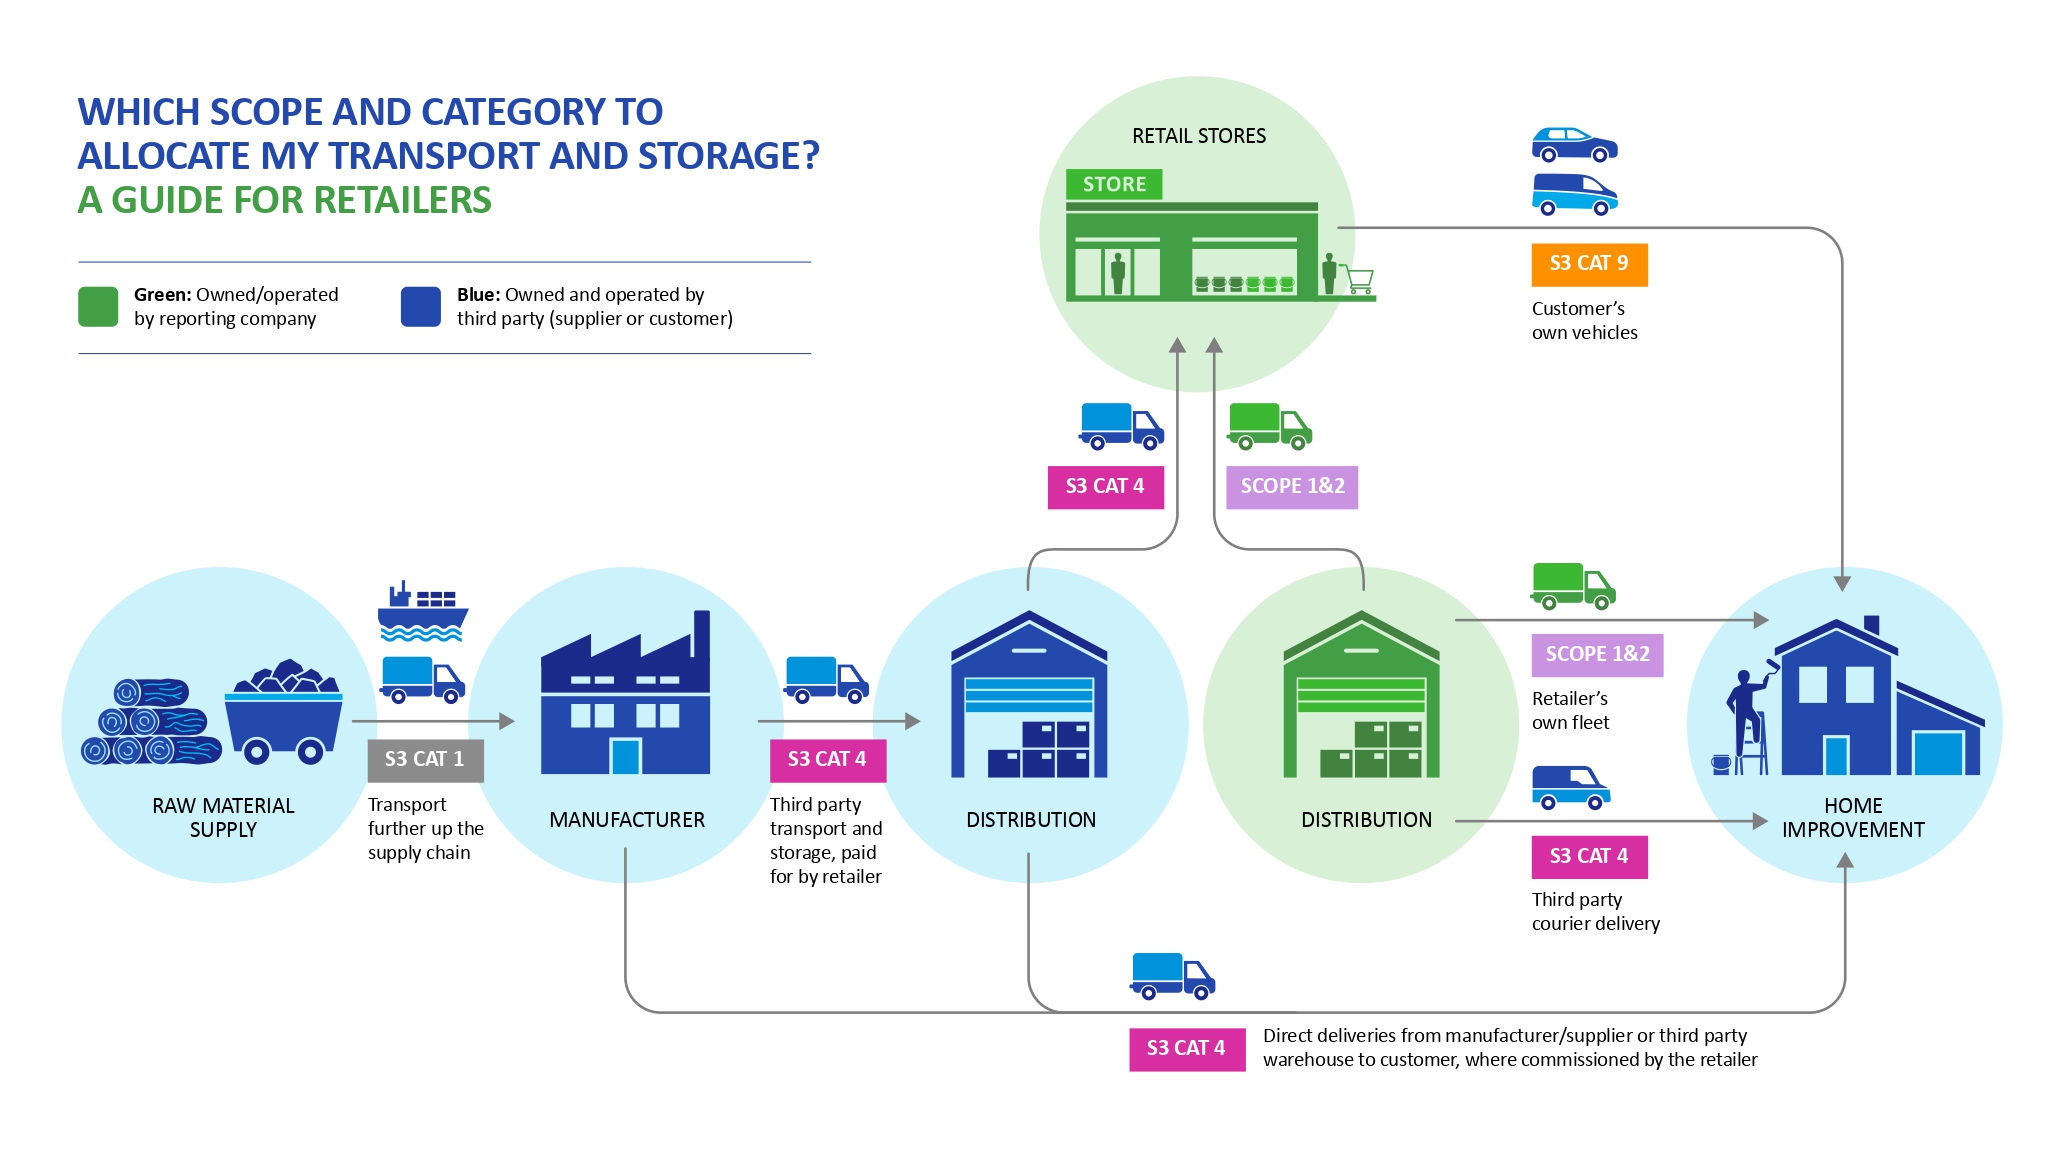
Upstream transportation involves the movement of products purchased in the reporting year from direct, or Tier 1 suppliers, to a company using vehicles and buildings not owned or operated by the reporting company. It also covers outbound movement of products in third party vehicles, such as deliveries to customers, where the transportation is commissioned by the reporting company.
This includes multi-modal shipping, where multiple carriers can be involved, and third-party transportation services, covering inbound and outbound logistics, and inter-facility transport. Emissions arise from various activities such as air, rail, road, and marine transport, as well as storage in warehouses and distribution centres.
Note that transportation of raw materials and intermediate products before the Tier 1 supplier is normally captured in Scope 3 Category 1, unless that transport happens to be operated by or directly paid for by the reporting company.
Downstream transportation, on the other hand, includes emissions from the transport and distribution of products after the point of sale, encompassing retail (from the point of view of a supplier to retail) and storage, in third party vehicles and buildings that are owned or commissioned (paid for) by customers and others in the downstream value chain. It also includes, optionally, emissions from consumer travel to retail stores.
Rule of thumb: If the reporting company pays for the third party transportation or distribution, then it is Scope 3 Category 4. If the customer collects, or it is outgoing and paid for by the customer, it is Category 9.
Calculating emissions from transportation
There are several methods that can be used to calculate emissions from purchased goods, as outlined below.
| Approach | Inputs | Conversion Factor Types | Benefits | Limitation | Worked Example |
| Fuel-based | Quantity of fuel consumed in the vehicles (i.e., scope 1 & 2 emissions of transport providers). To be supplied by the transport operators.
Also applicable to building energy consumption, metered or apportioned to your share of the building. | National or industry CO2e per unit of fuel consumed | Highest level of accuracy and robust year-on-year comparison.
Enables intensity-based comparisons of transportation suppliers. i.e. emissions per mile or tonne.
Best suited when 100% of the journey is for freighting your product or material. | Higher data collection requirements from suppliers
Transportation in large freighting methods such as aviation and sea cargo may not have available fuel consumption for your products. | Litre fuel consumed x relevant emission factor.
Refrigerant leakage (top-ups) x relevant GWP[1] conversion factor |
| Distance and mass based | Mass of product, distance carried, and mode of each shipment over the course of the reporting year (tonne.km). The mass of product shipped may be provided by the manufacturer or the transport operator. Distances may be provided by the transport operator, or you may need to conduct your own estimates based on sample distances. More detail below. | CO2e per tonne kilometre,
Tonnes in shipment x Distance (km) = Tonne.KM | Allows for the accurate apportionment of your product / material within general transport. Does not require primary fuel consumption data. | Degree of estimation involved with assuming the route travelled and how laden the vessel is. Requires reliable freight tonnage data which may not be available. | (Tonnes of product transported in shipment X kilometres travelled ) X the relevant tonne.km emission factor for that transportation method |
| Spend-based | The sum of the amount spent on transporting goods over the course of the year, split by mode of transport (air, road, rail, water) | National or industry average - CO2 e per unit of spend, allocated by type of product or sector of spend. i.e. an EEIO type factor as usable for Category 1. | Time and cost-efficient method. Indicative results, usable for screening and hotspot identification. | Only an approximation. Does not account well for such variables as economies of scale, variability between suppliers. | $ spend x conversion factor. You may need to adjust spend for inflation to the year of the conversion factor. See the Scope 3 Category 1 Guidance for more detail. |
[1] GWP= Global Warming Potential
Developing your Methodology
When deciding whether to use the Fuel-, Distance-, or Spend-based method for calculating transportation emissions, consider the availability and quality of data. Prioritise the more accurate Fuel-based method where fuel or electricity consumption from transport and warehousing providers is available. If your goods are “sharing” the vehicle or warehouse then you can apportion the consumption accordingly, taking advice from the service provider on your share.
If consumption data is not available, then the distance-based method is the next best option.
The Spend-based method should be used as a backup when neither fuel nor distance data is available, and can also be useful as part of the initial screening process to gauge the scale of emissions.
If fuel or spend based methods are selected, then add up the quantities of fuel and spend respectively and apply relevant factors that can be found in the locations outlined in the scope 3 accounting guide.
Where warehousing is required to hold stock by a third party before being shipped onwards, the energy used to light and heat/cool the space is relevant. This can be calculated from primary energy data, or failing that then using a kWh per floor area benchmark for your share of the storage area.
For distance-based, there are two datasets to collect.
- mass/volume of goods transported, including the mass of any additional packaging, such as pallets and Styrofoam that add to the mass of your goods in transit.
- Distance travelled
Ideally, your courier partner or supplier will have a record of the distance travelled. However, in the likely event this is not the case, there are a number of methods and considerations we can utilise to understand the distance from transporting goods. These are as follows:
Road
Use a route finder app such as google maps to determine the most likely transit route of a sample of trips and scale up to all.
Sea freight
Calculate the road route to port, then use a sea distance calculator to understand the distance travelled from port to port. Then calculate the distance from the port to final destination using rail or road.
Flights
Calculate the road route to airport, then use an air distance calculator for an appropriate sample of journeys. Then calculate the distance from the port to final destination.
Rail
Calculate the road route to the rail depot, then use an rail distance calculator to understand the distance travelled from station to station. Then calculate the distance from the port to final destination.
Multiple Stops
Use the appropriate transport route method to calculate the most likely route to each checkpoint destination/layover, making sure to reduce the mass/volume of the transported goods if any get offloaded on a downstream journey. Then proceed to calculate the onward journeys.
Direct to customer shipping
If shipping direct to the consumer, you may find yourself with thousands of different end locations. Calculating the individual emissions from each route could be an onerous and time-consuming task. In this instance, it is more efficient to select a centralised location to group a collection of end locations (for example: the centre of the letter postcode location) and multiply the resulting distances on methods up by the amount of journeys this applies to.
Refrigerated freight
If your goods require refrigerating whilst in-transit or storage, make sure to select refrigerated emission factors to account for the energy involved in cooling the containers. Additionally, best practice would require reporting any refrigerant gas losses from the unit whilst your goods are in transit. This information can only be acquired by communicating with the transport providers and apportioning your responsibility with the load.
Once the mass and distance datasets are collected, multiply them together for each trip to get a mass/volume per distance figure (e.g. tonne.km, litre.mile, lbs.mile). This is now ready to have a factor applied to it to generate emissions. Note that most factors will require mass.distance, and so volumetric figures may need to be converted into mass before proceeding.
Conversion Factor Sources
Below are a number of emission factor sources that need to be multiplied by the source data. These have been supplied on the basis that the resulting information from the data collection stage will be in monetary value for spend based, quantity of fuel for fuel-based, and mass.distance for distance based.
| Method | Source | Link |
| Fuel-based | UK Government Conversion Factors | https://www.gov.uk/government/collections/government-conversion-factors-for-company-reporting |
| ICAO Carbon Emissions Calculator (ICEC) | https://www.icao.int/environmental-protection/CarbonOffset/Pages/default.aspx | |
| Distance Based | UK Government Conversion Factors | https://www.gov.uk/government/collections/government-conversion-factors-for-company-reporting |
| ICAO Carbon Emissions Calculator (ICEC) | https://www.icao.int/environmental-protection/CarbonOffset/Pages/default.aspx | |
| Spend Based | UK Government/ University of Leeds | https://www.gov.uk/government/statistics/uks-carbon-footprint |
| US Government | https://cfpub.epa.gov/si/si_public_record_Report.cfm?Lab=CESER&dirEntryId=358530 | |
| Exiobase | https://www.exiobase.eu/ |